
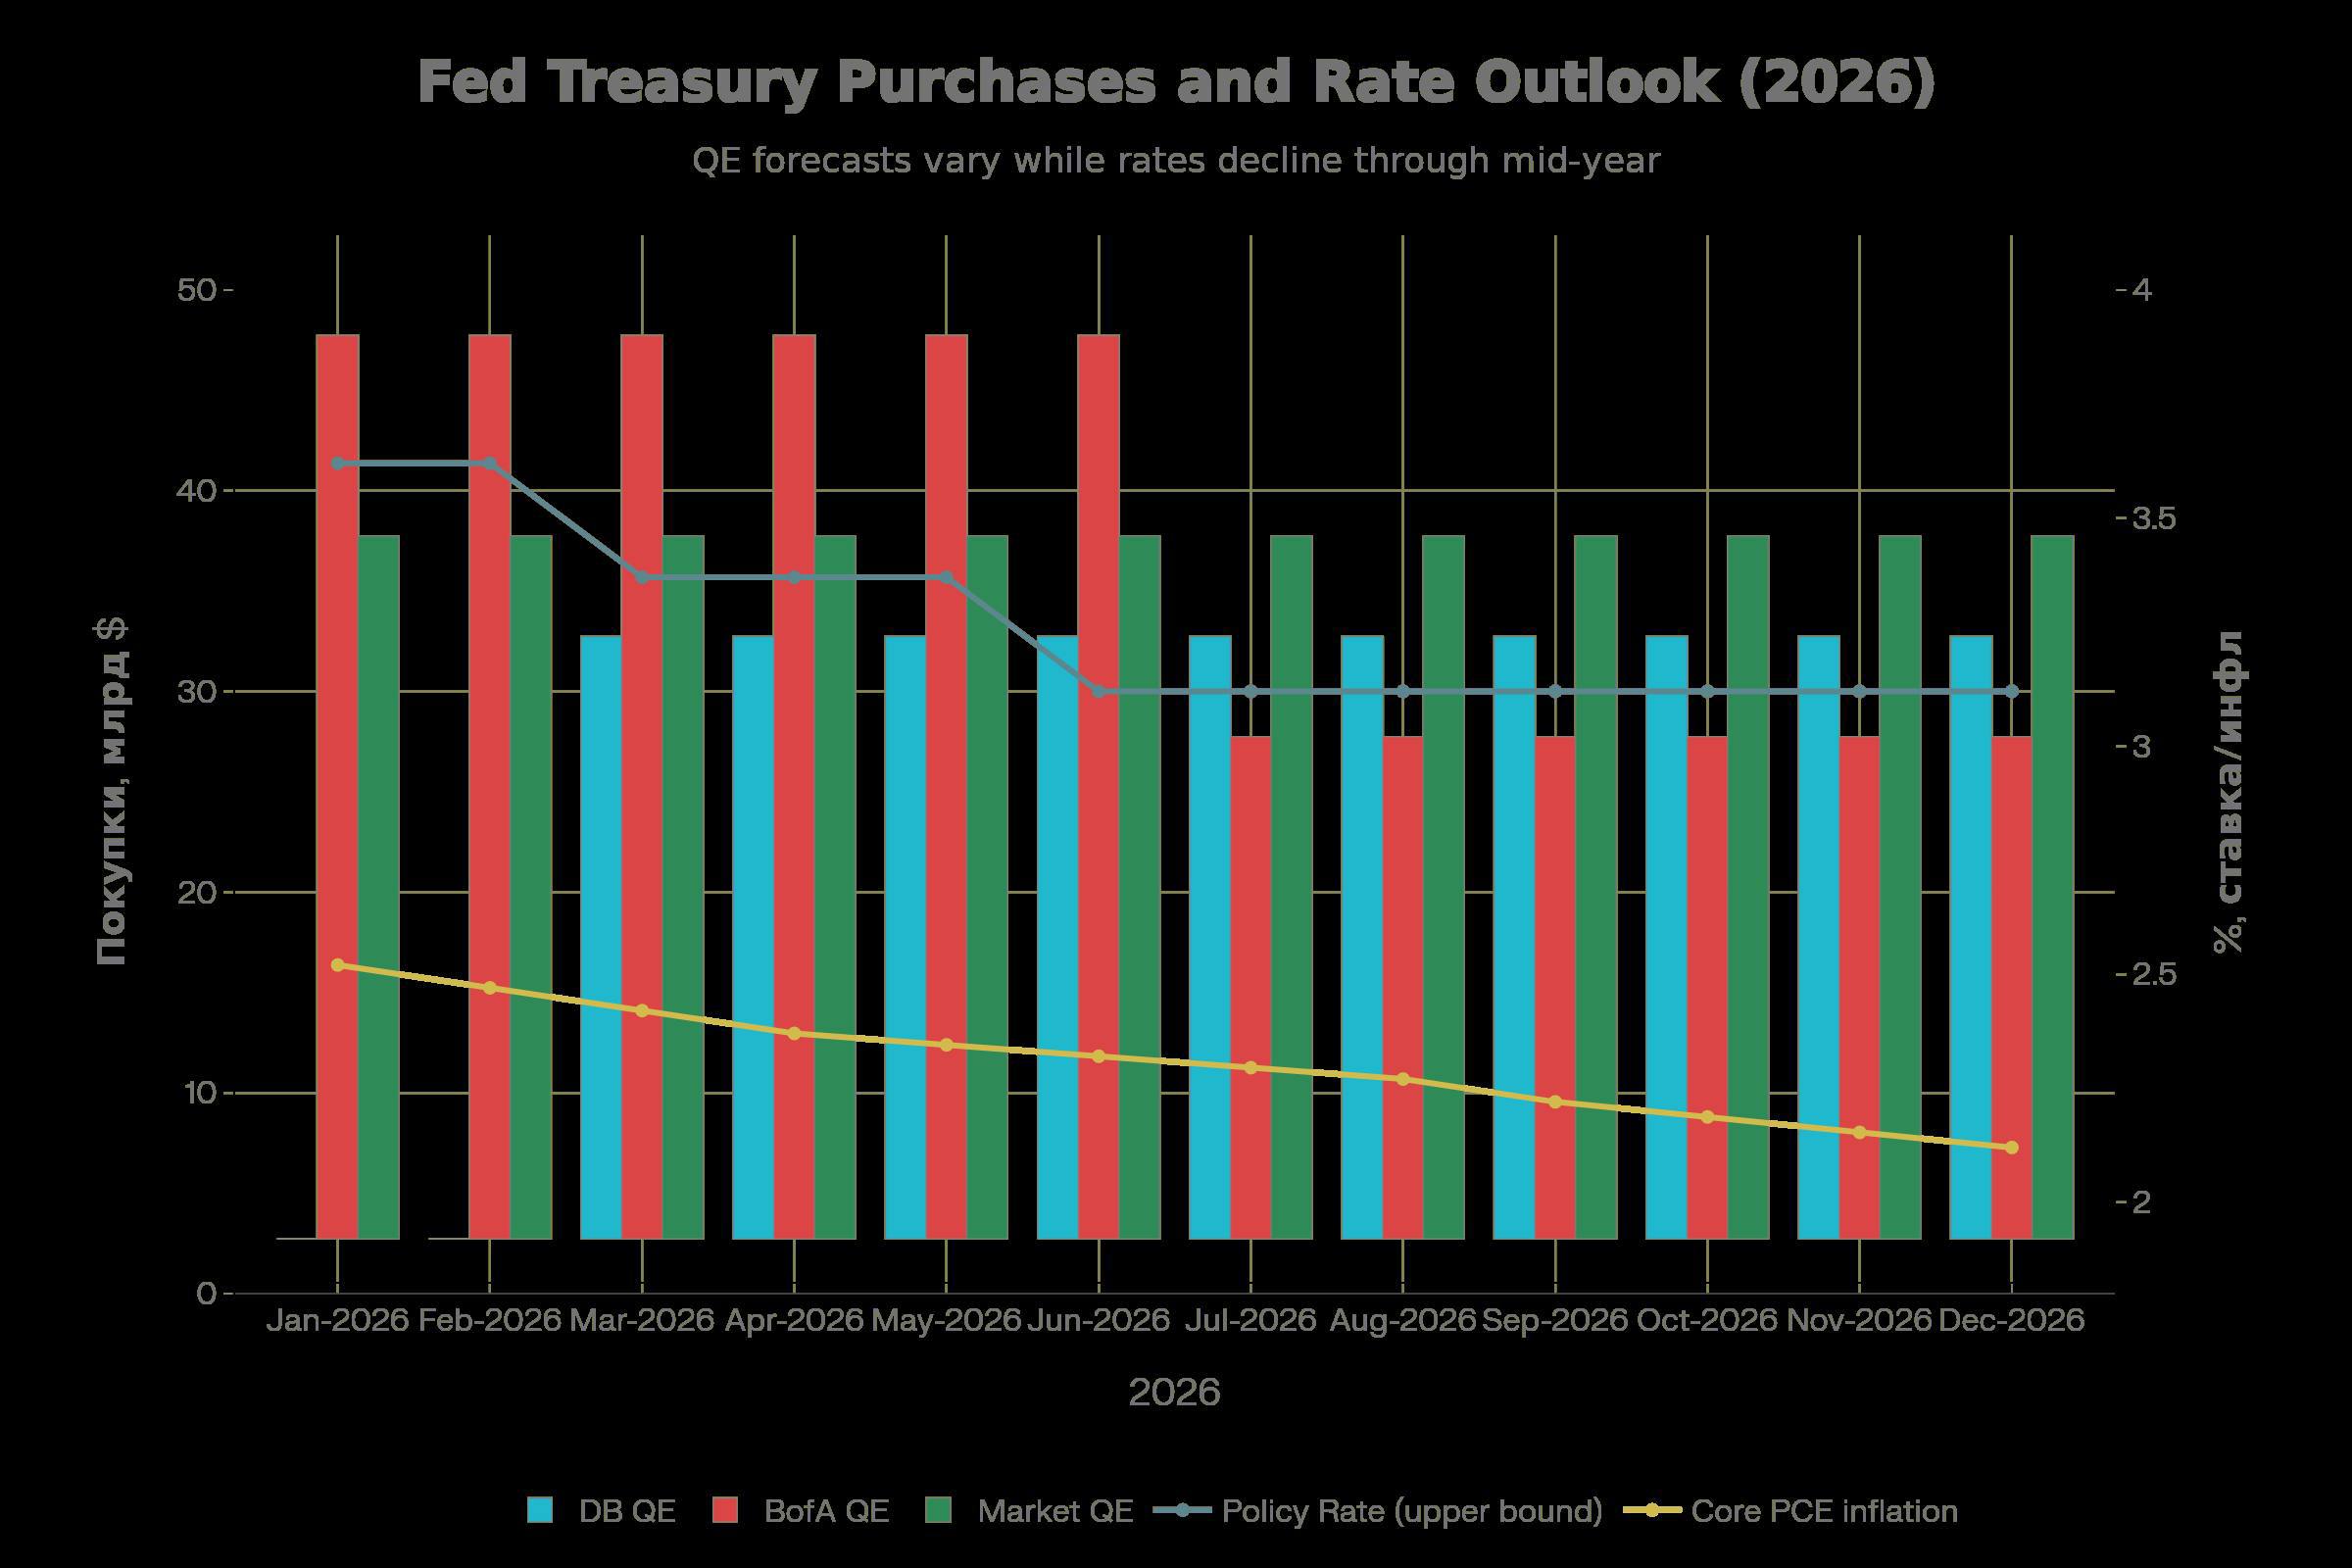
Follow Me Plz 🌐Hidden QE, inflation, Fed rate I've prepared a chart for you, which will form the basis of the investment strategy for 2026. 📈The Fed started buying Treasuries for $40 billion per month in December 2025 — officially, this is reserve management, but in fact, we understand that this is hidden QE. QT ended, the balance is growing, banks expect $30–45 billion per month throughout 2026. 📈The rate — one or two cuts in the spring-summer, core PCE inflation will drop from 2.4% to 2% by the end of the year. 📝What's on the chart: 📈Columns: volumes of Treasuries purchases according to bank forecasts — $30 billion from March (Deutsche Bank), $45 billion in the first half, then $25 (Bank of America), an average of $35 billion throughout the year. Liquidity peak in Q1-Q2. 📈The blue line on the right: the rate — 3.5% at the beginning, minus 0.25% in March, another decrease in June to 3.0%, then a pause. 📈The orange line: PCE inflation is gradually decreasing from 2.4% to 2.0%
The author hasn't signed the social smart contract — the cast may be restricted on farcaster.xyz, so the Farcaster app isn't offered below.